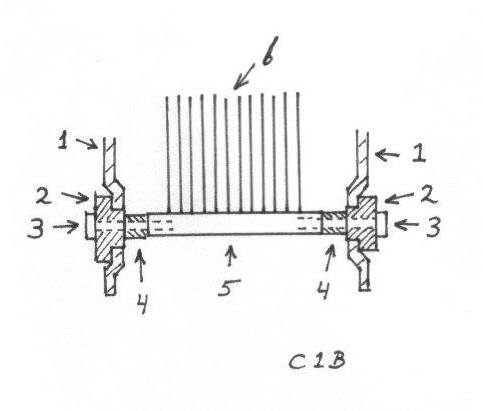
1= frame of tuning capacitor
2= plastic insulation ring
3= nylon screw
4= polyethene insulation block
5= copper connection bar for stator plates
6= stator plates
Experiments with LC circuits part 4
<< Go to part 3
Go to part 5 >>
Back to the index
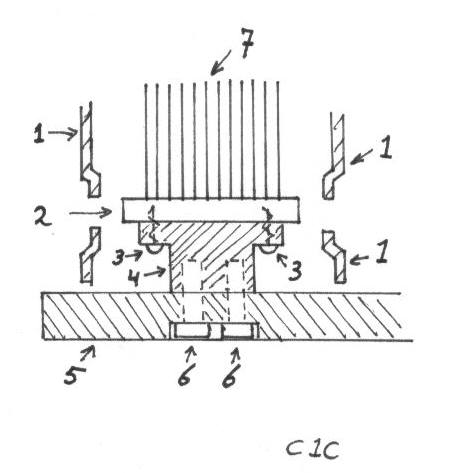
From tuning capacitor C1b I now removed the insulation rings which keeps the
stator on it's place.
I found that the used nylon screws gave some dielectric losses which reduces
circuit Q.
Now I use instead a polyethene block which supports the stator from the
underside.
In the following drawings this is shown., this version of tuning capacitor I
call: C1c.
|
|
Tuning capacitor C1b
1= frame of tuning capacitor |
|
Tuning capacitor C1c
1= frame of tuning capacitor |
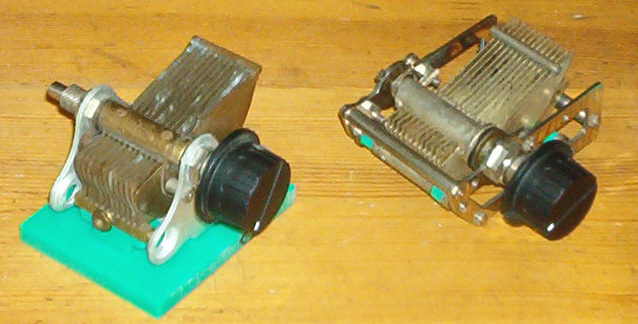
The plastic insulation blocks of tuning capacitor C2 are replaced by polyethene blocks (which are the green blocks on the next picture).
|
Left: C1c (495 pF).
Right: C2a (390 pF). |
After these changes, I measured the Q's again, they were increased.
The percentages of increase are also mentioned, compared to measurement 21 and
22.
|
Measurement |
LC combination |
F min |
F max |
Q |
Q |
Q |
Q |
|
23 |
L9 C1c |
542 |
2349 |
1072 |
947 |
815 |
658 |
|
24 |
L9 C2a |
606 |
2400 |
1143 |
1000 |
833 |
632 |
Now I have drilled a lot of 2 mm holes in the polyethene insulation blocks of
tuning capacitor C2a.
Hoping that removing insulation material will reduce dielectric losses even
more.
This version of tuning capacitor is called: C2b.
|
Measurement |
LC combination |
F min |
F max |
Q |
Q |
Q |
Q |
|
25 |
L9 C2b |
600 |
2382 |
1052 |
1000 |
875 |
714 |
The percentages mentioned are compared to measurement 24.
At 600 kHz there is a decrease in Q, how that comes, I don't know.
Maybe there was a measuring error in measurement 24, normally the accuracy of the
measured values are I think between +5% and -5%, but maybe this time the error
is higher.
Or maybe the Q is really reduced at 600 kHz, this is no problem, at low
frequencies a Q above 1000 is more than enough.
"Tot lering en vermaak" That's an old Dutch expression which
means "for learning and fun".
And that's why I made the following two measurements with lower Q coils, often
used in crystal receivers.
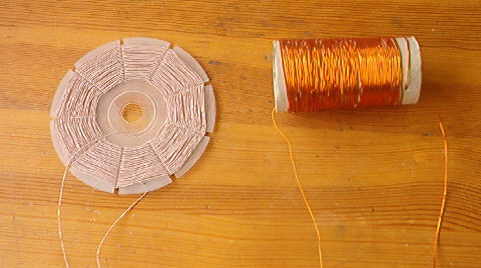 |
Coil L10 13 meters litzwire 40x0.07mm on a former made of a CD. The shiny aluminium layer is fully removed from the CD. Coil L11 |
The used tuning capacitor is C2b.
|
Measurement |
LC combination |
F min |
F max |
Q |
Q |
Q |
Q |
|
26 |
L10 C2b |
530 |
* |
358 | 371 | 346 | 304 |
|
27 |
L11 C2b |
761 |
3270 |
* |
211 |
234 |
241 |
* = not measured.
The measured values are not bad at all, but keep in mind that a very good tuning
capacitor is used.
So, a good comparison with measurement 1 to 16 is not possible, also because the
test method used now is much better.
<< Go to part 3
Go to part 5 >>
Back to the index