The material makes a right angle with the coil windings.
Experiments with LC circuits part 5
<<Go to part 4
Go to part 6 >>
Back to the index
Via measurements I determined the effect on circuit Q, if we place several materials near the coil of the LC circuit.
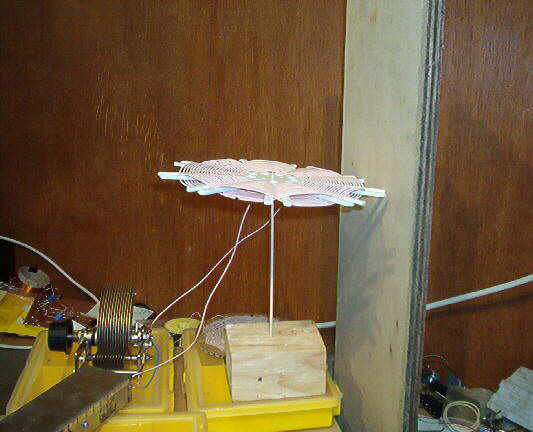
Test setup 1.
First I placed the material near the coil, so the material makes a right angle with the coil windings.
|
|
Test setup 1:
The material makes a right angle with the coil windings. |
The coil is spiderwebcoil L9
The given distance is measured between the material and the outside winding of
the coil.
Some materials are measured at several distances.
In measurement 28 there is no material placed near the coil, this measurement is
used as a 0% reference for the other measurements.
This measurement 28 is done some days earlier than the other measurements, maybe
building up the test setup again has some influence on measured values.
I also measured the frequency shift caused by the material near the coil.
| Measurement number |
material | distance (cm) |
frequency shift at 600 kHz. (kHz) |
Frequency shift at 1500 kHz. (kHz) |
Q 600 kHz |
Q 900 kHz |
Q 1200 kHz |
Q 1500 kHz |
| 28 | none | - | - | - | 1052 0.0% | 1000 0.0% | 875 0.0% | 714 0.0% |
| 29 | wood | 2 | -0.05 | -0.19 | 1000 -4.9% | 909 -9.1% | 779 -10.9% | 635 -11.0% |
| 30 | wood | 5 | * | * | 1034 -1.7% | 947 -5.3% | 827 -5.4% | 655 -8.2% |
| 31 | wood | 10 | * | * | 1052 0.0% | 967 -3.3% | 839 -4.1% | 681 -4.6% |
| 32 | cardboard | 2 | <0.03 | <0.03 | 1034 -1.7% | 1000 0.0% | 839 -4.1% | 673 -5.7% |
| 33 | cardboard | 5 | * | * | 1034 -1.7% | 978 -2.2% | 839 -4.1% | 697 -2.3% |
| 34 | polyethene | 2 | * | -0.07 | 1090 +3.6% | 1043 +4.3% | 902 +3.0% | 746 +4.5% |
| 35 | polypropylene | 2 | <0.03 | <0.03 | 1111 +5.6% | 1058 +5.8% | 902 +3.0% | 746 +4.5% |
| 36 | foam PVC | 2 | * | <0.03 | 1071 +1.8% | 1000 0.0% | 869 -0.7% | 750 +5.0% |
| 37 | aluminium | 2 | +2.25 | +5.60 | 1022 -2.8% | 967 -3.3% | 845 -3.4% | 683 -4.3% |
| 38 | aluminium | 5 | * | * | 1054 +0.2% | 1000 0.0% | 869 -0.7% | 721 +1.0% |
| 39 | iron | 2 | +3.12 | +6.50 | 622 -40.8% | 652 -34.8% | 591 -32.4% | 510 -28.6 |
| 40 | iron | 5 | * | * | 860 -18.2% | 841 -15.9 | 765 -12.5 | 633 -11.3 |
* = not measured.
How can the Q sometimes be increased?
In theory this is not possible, placing a material near the coil must always reduce circuit Q.
Probably it has to do with unaccuracy of the measurements, I also noticed that
the Q can be more than 5% different when I measure it again the other day.
Maybe it also has to do with the fact that the coil can move a little bit on the
top of the wooden stick, where I mounted it on.
Also the position of the tuning capacitor and amplifier can be changed after
turning the tuning capacitor.
The amplifier is build in a (tin plated) iron box, and in measurement 39 and 40
we have seen that iron has a large negative influence on circuit Q.
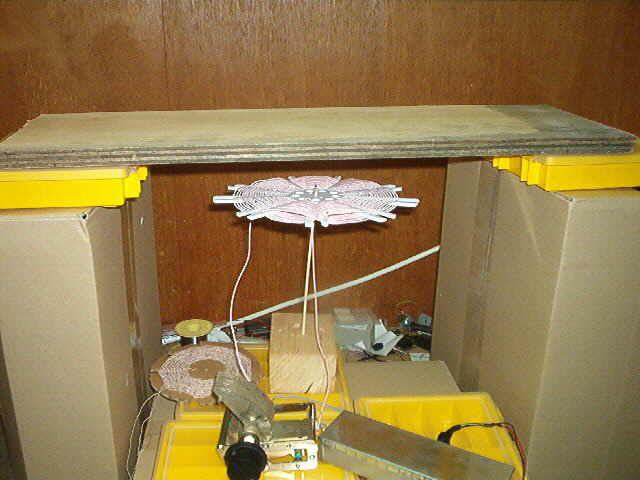
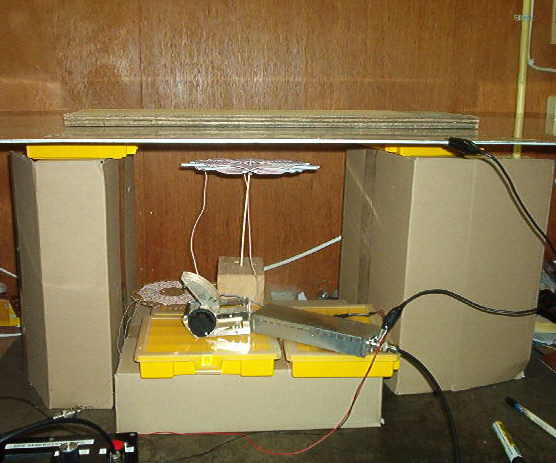
Test setup 2.
In this test setup the material is placed parallel to the coil windings.
|
Test setup 2:
The material is placed parallel to the coil windings. |
The given distances are measured between the material and the middle of the
coil.
Measurement 41 (without material above the coil) is the 0% reference for the
rest of the measurements.
In some measurements the circuit could not be tuned to 600 kHz, in that case the
lowest tuneable frequency was measured.
| measurement number |
material | distance (cm) |
frequency shift at 600 kHz (kHz) |
Frequency shift at 1500 kHz (kHz) |
Q 600 kHz |
Q 900 kHz |
Q 1200 kHz |
Q 1500 kHz |
| 41 | none | - | - | - | 1056 0.0% | 1022 0.0% | 909 0.0% | 753 0.0% |
| 42 | wood | 2 | -0.46 | -5.97 | 731 -30.7% | 535 -47.6% | 385 -57.6% | 275 -63.5% |
| 43 | wood | 5.5 | -0.08 | -0.87 | 983 -6.9% | 874 -14.5% | 714 -21.4% | 568 -24.6% |
| 44 | pertinax | 2 | -0.14 | -2.52 | 923 -12.6% | 811 -20.6% | 667 -26.6% | 483 -35.8% |
| 45 | polyethene | 2 | -0.11 | -0.67 | 1090 +3.2% | 1034 +1.2% | 923 +1.5% | 753 0.0% |
| 46 | polypropylene | 2 | -0.02 | -0.59 | 1090 +3.2% | 1046 +2.3% | 909 0.0% | 731 -2.9% |
| 47 | foam PVC | 2 | -0.03 | -0.59 | 1052 -0.4% | 1034 +1.2% | 895 -1.5% | 769 +2.1% |
| 48 | copper | 2 | +43.9 | +102.1 | 263 -75.1% | 313 -69.4% | 344 -62.2% | 358 -52.5% |
| 49 | copper | 5.5 | +5.9 | +13.4 | 768 -27.3% | 810 -20.7% | 754 -17.0% | 652 -13.4% |
| 50 | aluminium | 5.5 | +21.0 | +48.0 | 914 -13.4% | 891 -12.8% | 845 -7.0% | 724 -3.8% |
| 51 | iron | 2 | +107.1 | +267.1 | * | 47 -95.4% | 50 -94.5% | 46 -93.9% |
| 52 | iron | 5.5 | +18.5 | +43.3 | 245 -76.8% | 273 -73.3% | 300 -67.0% | 294 -60.9% |
I have also try to make a measurent with aluminium at 2 cm distance, but then the voltage over the circuit was too low to measure.
In this test setup the material could come closer to the coil windings, so the reduction of Q is also higher (compared to test setup 1).
Conclusions:
1- Iron has a large negative effect in the Q.
So in your receiver, don't use iron components (e.g. audio transformers) at
small distance near your coil.
2- From the measured metals, aluminium has the least effect on circuit Q.
3- Wood and pertinax gives quite a high reduction of Q, so don't use these
materials for coil formers.
4- Polyethene, polypropylene and foam PVC gives the best results in these tests,
the differences between are small.
Test setup 3
Measurement 53 is done with a aluminium plate 5.5 cm above the coil, just
like in measurement 50, but now the plate is grounded to circuit ground.
Now I can touch the aluminium plate without changing the frequency of the
circuit, without ground connection there was in that case a frequency shift.
The frequency shift the aluminium gives is in both cases (with or wihout ground)
the same.
On top of the aluminium, I now layed some other materials, and measured the extra
frequency shift this gives.
Also the Q is measured, and the difference calculated compared to measurement
53.
| Measurement number |
Material aluminium plus: |
Frequency shift at 620 kHz (kHz) |
Frequency shift at 1500 kHz (kHz) |
Q 620 kHz |
Q 900 kHz |
Q 1200 kHz |
Q 1500 kHz |
| 53 | - | - | - | 914 0.0% | 947 0.0% | 839 0.0% | 753 0.0% |
| 54 | wood | +0.06 | 0.00 | 942 +3.1% | 927 -2.1% | 845 +0.7% | 744 -1.2% |
| 55 | iron | +0.52 | +0.82 | 928 +1.5% | 918 -3.1% | 851 +1.4% | 738 -2.0% |
Conclusion: the influence of wood and iron on the Q almost disappears when we place a aluminium sheet between it and the coil.
This didn't become clear until now.
That's why I made the following measurement, now I only look at the voltage over
the circuit, not at the bandwidth.
The voltage over the circuit was adjusted to 4.00 Volt peak-peak.
Then I layed several materials on the coilwindings, without touching the tuning
capacitor, and measured how much reduction of voltage this gives.
The generator frequency was adjusted each time, because the material on the coil
gives some frequency shift.
|
Reduction of the voltage over the circuit as a function of frequency
and material on the coil.
|
In this test, polypropylene gives the best results.
De reduction of voltage, must in theory be the same as the reduction in Q.
Amplifier covered with aluminium
The used amplifier has a iron housing, and is placed at about 20 cm from the coil of the LC circuit.
In the following measurement the amplifier housing is covered with a sheet of aluminium, and the differences in Q are measured.
| Measurement number |
LC combination L9 C2b |
Q 600 kHz |
Q 900 kHz |
Q 1200 kHz |
Q 1500 kHz |
| 59 | Without aluminium plate on amplifier. |
1113 0.0% | 1071 0.0% | 945 0.0% | 762 0.0% |
| 60 | With aluminium plate on amplifier. |
1134 +1.9% | 1111 +3.7% | 960 +1.6% | 819 +7.5% |
By covering the iron box with aluminium , the Q increases.
<< Go to part 4
Go to part 6 >>
Back to the index